LAI: Not Just How Green the Leaves Are, but How Much Leaf the Crop Actually Has
LAI (Leaf Area Index) measures total leaf area relative to ground area. Unlike NDVI, it gives a more direct picture of how much foliage the crop has and how far the canopy has developed.
Estimated reading time: 2 minutes
LAI, or Leaf Area Index, measures the total leaf area of a crop relative to the ground area it covers.
For example, an LAI of 3 means that, on average, there are about 3 m² of leaf surface above every 1 m² of ground.
LAI vs NDVI
NDVI mainly shows how green and vigorous the leaves are. LAI gives a more direct measure of how much foliage there is and how far the canopy has developed.
So it tells you not only how green the crop is, but how much leaf mass it has actually built up.
Why it matters
Tracking LAI through the season lets you:
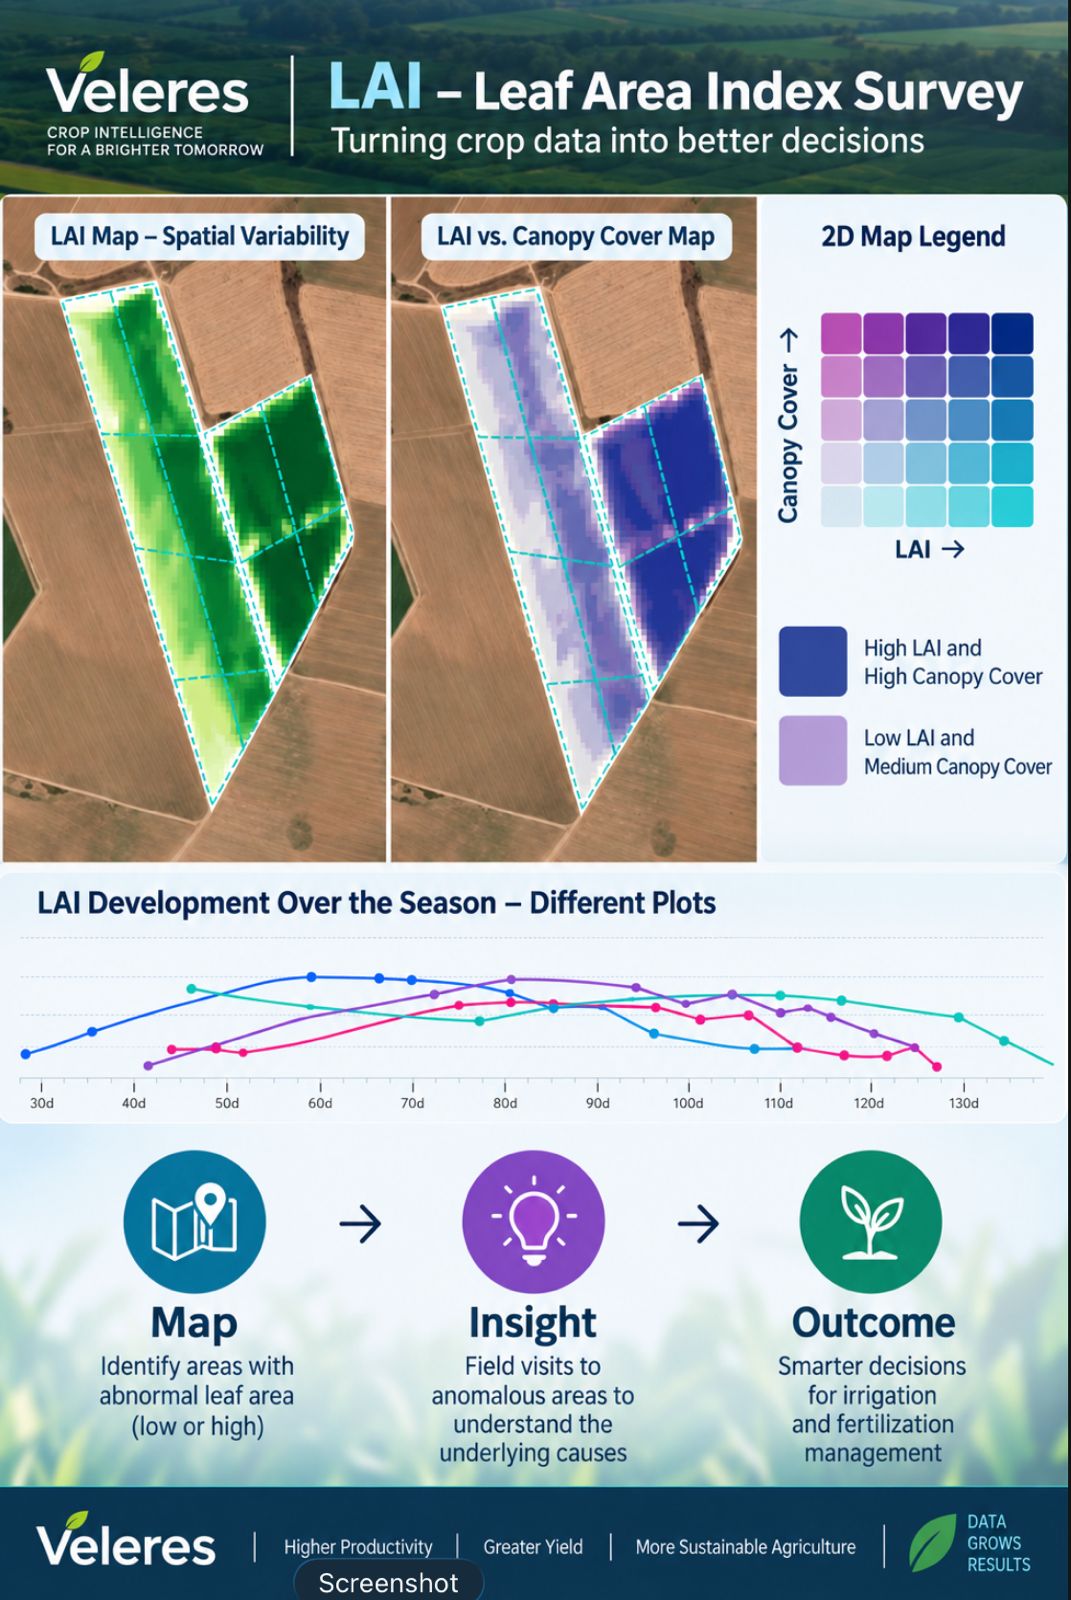
- Spot zones with lower-than-expected leaf area, which may point to weak development, water stress, nutrient deficiency or another problem.
- Spot zones with unusually high leaf area, which in some cases can indicate excessive vegetative growth at the expense of yield (for example in potatoes), or shading that reduces yield (for example in banana plantations).
- Compare fields, or different zones within the same field.
- Follow the rate of canopy development over the season.
- Direct field scouting to the zones that stand out and understand what is driving them.
LAI and ground cover
LAI and FCOVER complement each other:
- FCOVER describes how much of the ground is covered by vegetation.
- LAI describes how much leaf area sits above that ground.
So two zones can show similar ground cover yet differ considerably in the amount of foliage and in canopy structure.
For example:
- A zone with high LAI and high cover indicates a dense, well-developed canopy.
- A zone with low LAI and moderate cover may indicate a sparser canopy or incomplete development.
LAI maps in Veleres
In Veleres you can see how LAI varies across each field and compare it with ground cover and NDVI, helping you manage the crop more effectively throughout the season.
The aim is to turn the data into a simple chain of action: Map → Insight → Outcome
- Map: identify zones with unusual leaf area
- Insight: targeted scouting to understand the causes
- Outcome: informed decisions on irrigation and fertilisation