Satellite Indices in Precision Agriculture: From Map to Field
What are satellite indices, what do the colors on the map really show, and how do we convert remote sensing data into actionable field decisions? The first article in our series on precision agriculture.
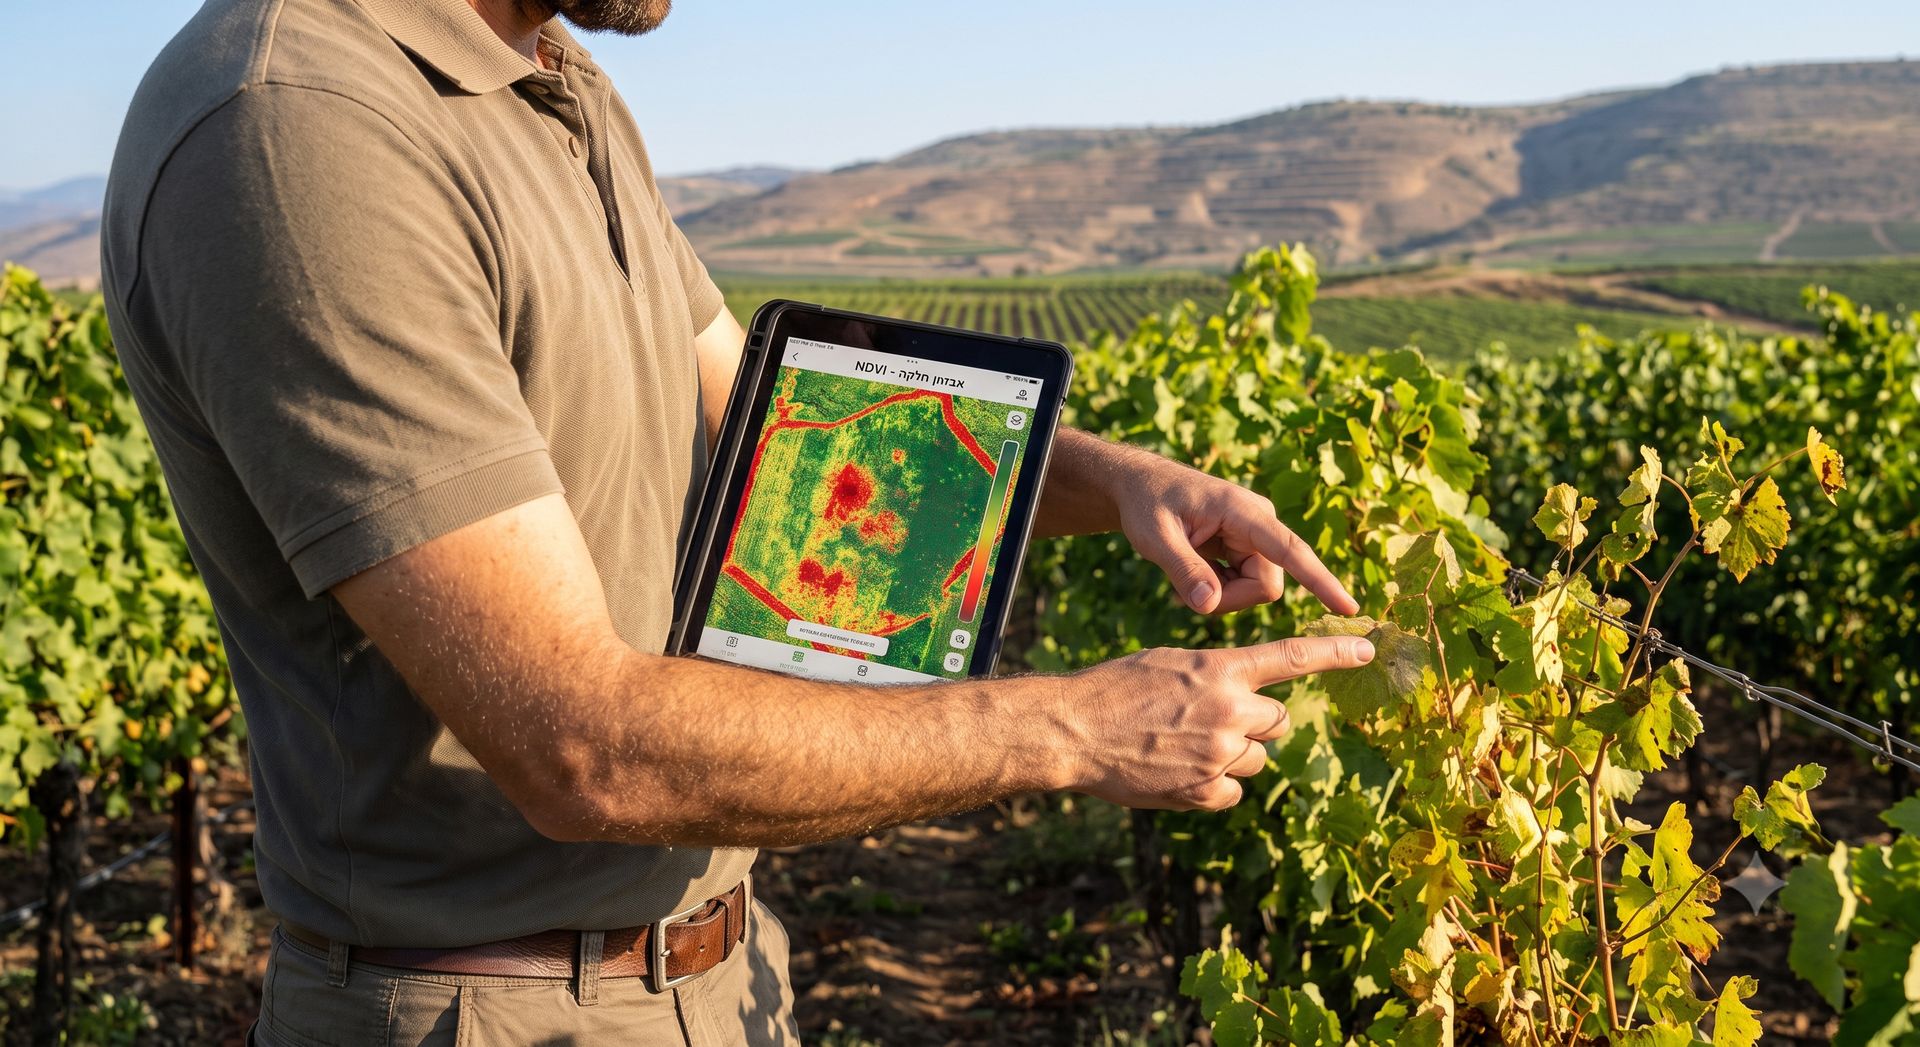
⏱ Estimated reading time: 5 minutes
Almost every farmer is familiar with NDVI — but what about other satellite indices?
This is the first article in a series exploring the use of satellite indices in agriculture. In each post, we'll focus on a different index, explain in simple terms how it is calculated, discuss its key applications, and share practical field examples.
Let's start with the basics: What is a satellite index, what do the colors on the map really represent, and how do we turn satellite data into an everyday operational tool?
What Is a Satellite Index?
Sensors mounted on satellites measure reflected solar radiation from the Earth's surface across different wavelengths. Vegetation, soil, and water reflect and absorb radiation differently — giving each a unique "spectral signature."
A satellite index is a value calculated through a mathematical combination of two or more spectral bands. The goal is to highlight a specific ground feature, such as vegetation presence, vigor, canopy coverage, or a response that may be related to the water status of the plant or soil.
The most widely known index is NDVI, which is calculated using red and near-infrared (NIR) reflectance to highlight differences in vegetation status.
What Do the Colors on the Map Show?
Each unit on an index map represents a pixel — a ground area sized according to the sensor's resolution. A numeric value is calculated for each pixel, and these values are displayed using a color scale.
The colors allow for quick identification of variability and anomalies within a plot, but they do not constitute an agronomic diagnosis on their own. An area showing a different color may indicate variations in crop growth, but it could also be influenced by bare soil, weeds, soil moisture, row architecture, or image quality.
Therefore, the map helps locate the area, but generally cannot determine the cause of the anomaly on its own.
Key Applications in Precision Agriculture
- Identifying Variability & Anomalies: Even a field that appears uniform from the ground may harbor areas developing at different rates. Index maps help pinpoint areas with abnormal values (high or low) relative to the rest of the field. A localized shift may indicate irrigation issues, poor drainage, disease, pest pressure, nutrient deficiency, soil variation, or crop damage — but the map generally cannot determine the cause on its own.
- Targeted Field Scouting & Sampling: Instead of scouting a plot randomly, you can use the Velers app to select areas of interest and navigate directly to anomalous points. This saves valuable time and focuses attention where intervention is actually needed.
- Continuous Crop Monitoring: Comparing maps across different dates throughout the season makes it possible to track vegetation progress and evaluate whether spatial gaps are narrowing, expanding, or remaining static.
- Evaluating Corrective Actions: Sequential maps help assess how crops respond to an action performed in irrigation, fertilization, or another agricultural management practice. However, a change in the index does not necessarily prove that the action caused the change — it is also necessary to take into account the growth stage, irrigation faults that occurred, and agrotechnical operations performed.
- Creating Management Zones: When a certain pattern repeats over time, it can be combined with additional data to divide the field into management zones. Such division can assist in planning sampling, irrigation, fertilization, yield estimation, and decision-making tailored to the different areas in the plot.
Not Every Map Layer Is an Index
It is important to distinguish between a spectral index (such as NDVI) and biophysical variables (such as LAI or Fractional Vegetation Cover):
- Spectral Index: Calculated directly from a combination of spectral bands.
- Biophysical Variable: The output of a model that translates spectral data into a quantitative estimate of a physical plant property.
A low value on a map can result from various factors: stress, bare soil, missing plants, weed pressure, or simply an early growth stage. In row crops that do not close the canopy in early stages (such as vineyards or pineapples), a single satellite pixel aggregates plants, soil, and inter-row weeds together — meaning the value does not represent the crop alone.
How to Work with Indices in Velers
To prevent data overload, we selected a core set of agronomically meaningful indices within the Velers app.
- Select the Index: Choose the index suited to your specific agronomic question.
- Detect Variability: Identify anomalous or contrasting zones in the plot.
- Compare History: Review past maps using side-by-side or graph views.
- Analyze Trends: Determine whether the pattern is new or recurring.
- Plan Scouting: Pin points of interest in the app and build a navigation route.
- Field Verification: Navigate to the marked points and perform targeted ground-truthing.
- Document Findings: Capture photos and geotag notes directly in the app.
- Expert Decision: Analyze findings with your agronomist/advisor to decide on corrective action.
- Track Results: Upon the next satellite update, re-check the area to verify whether the action achieved the desired outcome.
Conclusion
A satellite index converts physical measurements into a spatial map, allowing you to track variability over space and time. Its power lies not in providing absolute answers, but in highlighting anomalies, focusing field checks, and empowering decision-making.
The map tells us where to look. Agricultural knowledge and field inspection, accompanied by our guide and agronomist, help understand why and decide on the corrective action to take.